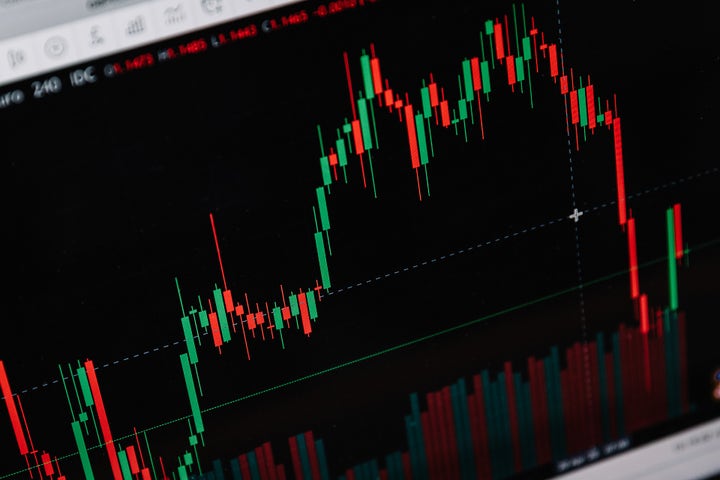
Looking At Coinbase Glb's Recent Unusual Options Activity Current Price:$295.74, RSI, Overbought territory, Day Change:+0.17% Indicators, Earnings Release Date, 83 days, Stock:Coinbase Global, COIN Company Information by https://www.benzinga.com/

AI Insights:
Simple Explanation:
Alright, imagine you're playing a game of Monopoly. In this game, there's a special card called "Coinbase Global Inc" (COIN). You can buy or sell this card just like the properties in the game.
Right now, the price of COIN is going up by 0.17%. That means if you bought it yesterday for $295.73, today you could sell it for $295.74! It's like when you roll a high number on the dice and land on a really cool property.
Something called "RSI indicators" is showing that COIN might be getting too expensive soon. This is like when your friend has lots of money in the game, but it might run out if they keep buying properties without thinking.
Some people who watch this COIN card closely (called analysts) think it's going to go down in price a bit. But another person thinks it will go up more! They all have different opinions like in Monopoly when everyone has different strategies.
There's also some unusual stuff happening with the special COIN cards that only big players (smart money) know about, but we can keep an eye on that too if you want!
So, in simple terms, this is just a quick update saying what's happening with the price of "Coinbase Global Inc" right now, like how many times it went up or down and what others think will happen next. Just like keeping track of your properties and money in Monopoly!
Read from source...
Critical Perspective:
Based on the provided text, here are some potential criticisms and inconsistent elements:
1. **Sentiment Inconsistency**:
- The opening sentence states that the COIN price is up 0.17%.
- However, it's followed by a warning from RSI indicators hinting at an overbought state, which could suggest a potential downturn.
2. **Analyst Disagreement**:
- While some analysts are maintaining or increasing their target prices (Needham at $290), others have lowered theirs (P Piper Sandler to $245).
- The overall average target price has decreased over the past month, reflecting diverse opinions among analysts.
3. **Lack of Context in RSI Indicator**:
- The text mentions that RSI indicators hint at being overbought but doesn't provide a specific level or context for what 'overbought' means in this context.
- Typically, RSI > 70 is considered overbought, but without this specific indicator value, it's difficult to interpret the significance.
4. **Emotional Language**:
- The term "Smart Money on the Move" might evoke a sense of urgency or excitement, while the mention of "potential market movers" could also appeal to readers' emotions.
- However, these phrases are subjective and don't provide tangible information about why big money is moving or what specific 'moves' these are.
5. **Self-Promotion**:
- The text includes several promotions for Benzinga's products and services (Benzinga Edge, Pro platform, Unusual Options board), which could be perceived as biased or self-serving.
6. **Lack of Recent Analyst Ratings**:
- Most analysts mentioned have not updated their ratings recently (one from B of A Securities is maintained, while others are from early 2023). This might make the analysts' opinions less relevant to today's market situation.
Sentiment Analysis:
Based on the information provided, here's a breakdown of the sentiment:
**Positive:**
- The stock price is up by 0.17%.
- Next earnings are expected in 83 days.
**Neutral/Bearish:**
- RSI indicators suggest the stock may be approaching overbought conditions.
- Analysts' average target price ($239.6) is below the current price of $295.74.
- Some analysts have lowered their ratings or reduced their target prices:
- BofA Securities: Neutral with a target price of $214.
- Barclays: Equal-Weight with a target price of $204.
- Piper Sandler: Lowered rating to Neutral with a new price target of $245.
**Neutral/Bullish:**
- Some analysts maintain or increase their target prices:
- Needham: Buy rating with a target price of $290.
- Monness, Crespi, Hardt: Downgraded to Buy with a price target of $245.